
settlement data annotation
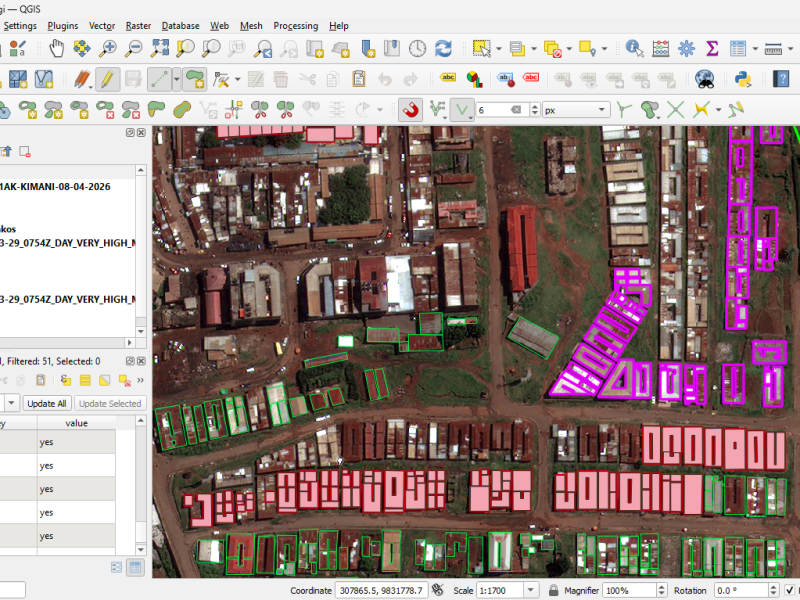
In this image, I am working within QGIS to perform settlement data annotation using high-resolution satellite imagery. The task involves digitizing building footprints and other structures within a densely populated area, likely an informal settlement.
You can see that I have created multiple vector layers where different features are being annotated using polygons. The colored outlines such as red, green, and purple represent categorized building footprints or structures that I have manually traced from the imagery. This process requires a high level of accuracy to ensure that each structure is correctly captured in terms of shape, size, and location.
On the left panel, the attribute table shows that each annotated feature is labeled, for example as “building = yes,” which helps in structuring the dataset for further analysis or integration into mapping systems like OpenStreetMap. I also ensure consistency by validating features and organizing them into layers based on dates or annotation sessions.
Overall, this demonstrates my hands-on experience in geospatial data annotation, including image interpretation, precise digitization, attribute assignment, and quality control using QGIS skills that are essential for producing reliable datasets for mapping and machine learning applications.